

Mastering low-risk entry points in forex trading requires a systematic approach. By conducting a top-down analysis, you can identify high-probability zones and precise entry triggers.
Start with higher time frames to understand the overall market trend, then refine your analysis on medium and lower time frames.
This method, combined with effective risk management, enhances your trading decisions and helps you achieve consistent results.
Let’s dive into the details!
1. Start with the Higher Time Frames (HTF)
Monthly, Weekly & Daily Charts
Begin by analyzing the overall market trend on the monthly, weekly and daily charts. Look for key levels of support and resistance, trend lines, and major price patterns such as Order Blocks, Breaker and AMD (the power of 3).
This helps you understand the broader market direction and identify high-probability zones.
For instance.
-
- Monthly Charts – Determines Long Term Trend
-
- Weekly Charts – Determines Major Trend
-
- Daily Charts – Determines Short Term Trend
2. Identify Key Levels
Key levels such as SNR & SND should be identified on HTF
-
- SNR (Support and Resistance): Mark significant support and resistance levels on the HTF. These levels often act as barriers where price action may reverse or consolidate or make a continuation.
-
- SND (Supply and Demand Zones): Identify areas where there has been a significant imbalance between buyers and sellers. These zones can provide clues about potential entry points.
3. Move to Medium Time Frames
This is where you want to see a Breakout (BO) or BMS confirmation. Identify breaks of structure or trend reversals that confirm the direction you’ve identified on the higher time frames.
You can also use your medium TF for entry if the risk is not more than 30 pips.
So, what is Medium TF?
-
- Monthly, Weekly, Daily
-
- Weekly, Daily, H4
-
- Daily, H4, H1
-
- H4, H1, M15
Depending on the TF matrix you choose, your medium TF will include Weekly, Daily, H4 and H1
4. Look for Entry Triggers
On the lower time frames (Daily, H4, H1 or M15), look for specific price action signals such as inside bar candle, Engulfing OBs, or Double Maru that align with the higher time frame analysis.
5. Confirm with Other Confluences on LTF
One of the best confluences for confirmation includes 3D Trendline Confirmation. Check here a detailed post on how to effectively use Trendline for confirmation.
6. Manage Your Risk
-
- Stop Loss Placement: Place your stop loss according to your entry model. If it’s an OB, swing high/low etc. An ideal entry model should have an average of 30 pips or around there.
-
- Position Sizing: Ensure your position size aligns with your risk management strategy, typically risking only a small percentage of your trading capital on each trade.
Example Scenario
-
- MONTHLY POI + WEEKLY BMS

-
- WEEKLY POI + DAILY BMS

-
- DAILY POI + H4 BMS

-
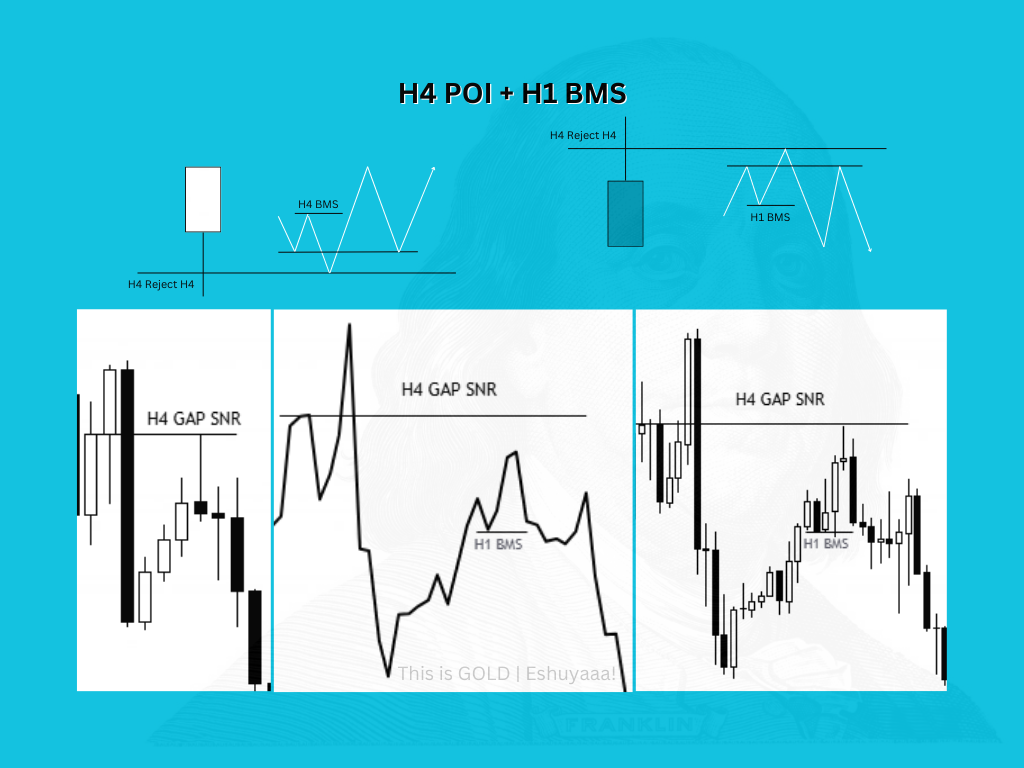
- H4 POI + H1 BMS
- H1 POI + M15 BMS